Product Trends Analysis
The Product Trends page transitions your insights from macro-level categories down to granular, individual item metrics. By exploring individual product velocities, consumer engagement behaviors, and direct supplier data, brand managers can make informed decisions regarding stock distribution, marketing visibility, and inventory optimization.
1. Global Filter Framework
To streamline your workflow, this dashboard utilizes the exact same filtering parameters as the category level. You can seamlessly isolate your target market data by adjusting the Time Period, Sort By preferences, and the interactive Minimum Growth Rate Slider.
For an in-depth breakdown of how these specific filter matrices operate, please refer to the Filter Framework Guide.
2. Product Performance Overview List
Below the filtering panel, individual products are ranked and listed based on your active criteria. This view provides an immediate snapshot of baseline operational health.
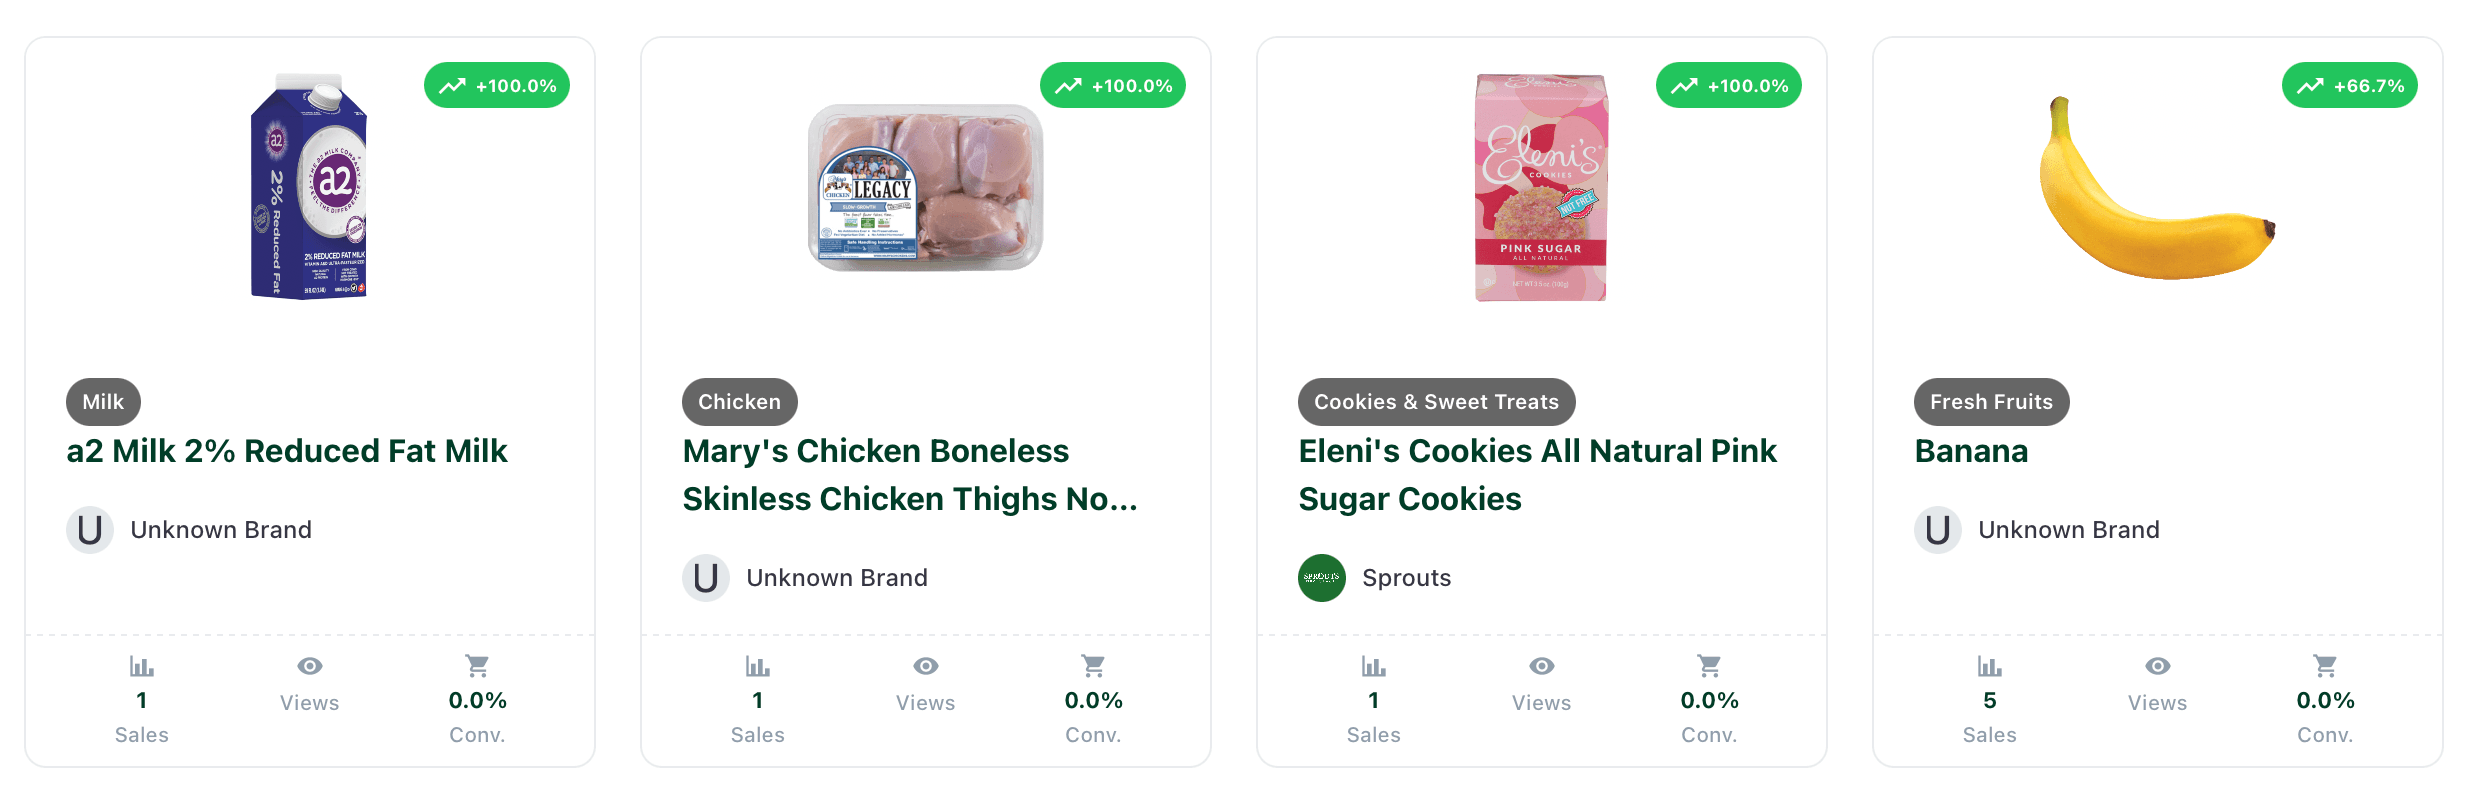
Every entry in the main overview displays four critical data points:
- 🏢 Brand: The authorized manufacturer or distributor name associated with the product.
- 📊 Sales: The absolute gross units or monetary volume moved during the selected timeframe.
- 👁️ Views: The total number of visual impressions the product earned in search results or digital aisles.
- 📈 Conversions: The percentage rate at which customer views translated into finalized purchases.
3. Deep Dive: The Product Details Explorer
Selecting any individual item from the list shifts your context into a dedicated Product Analytics View. This section uncovers deeper metrics, supplier networks, and recommended operational actions.
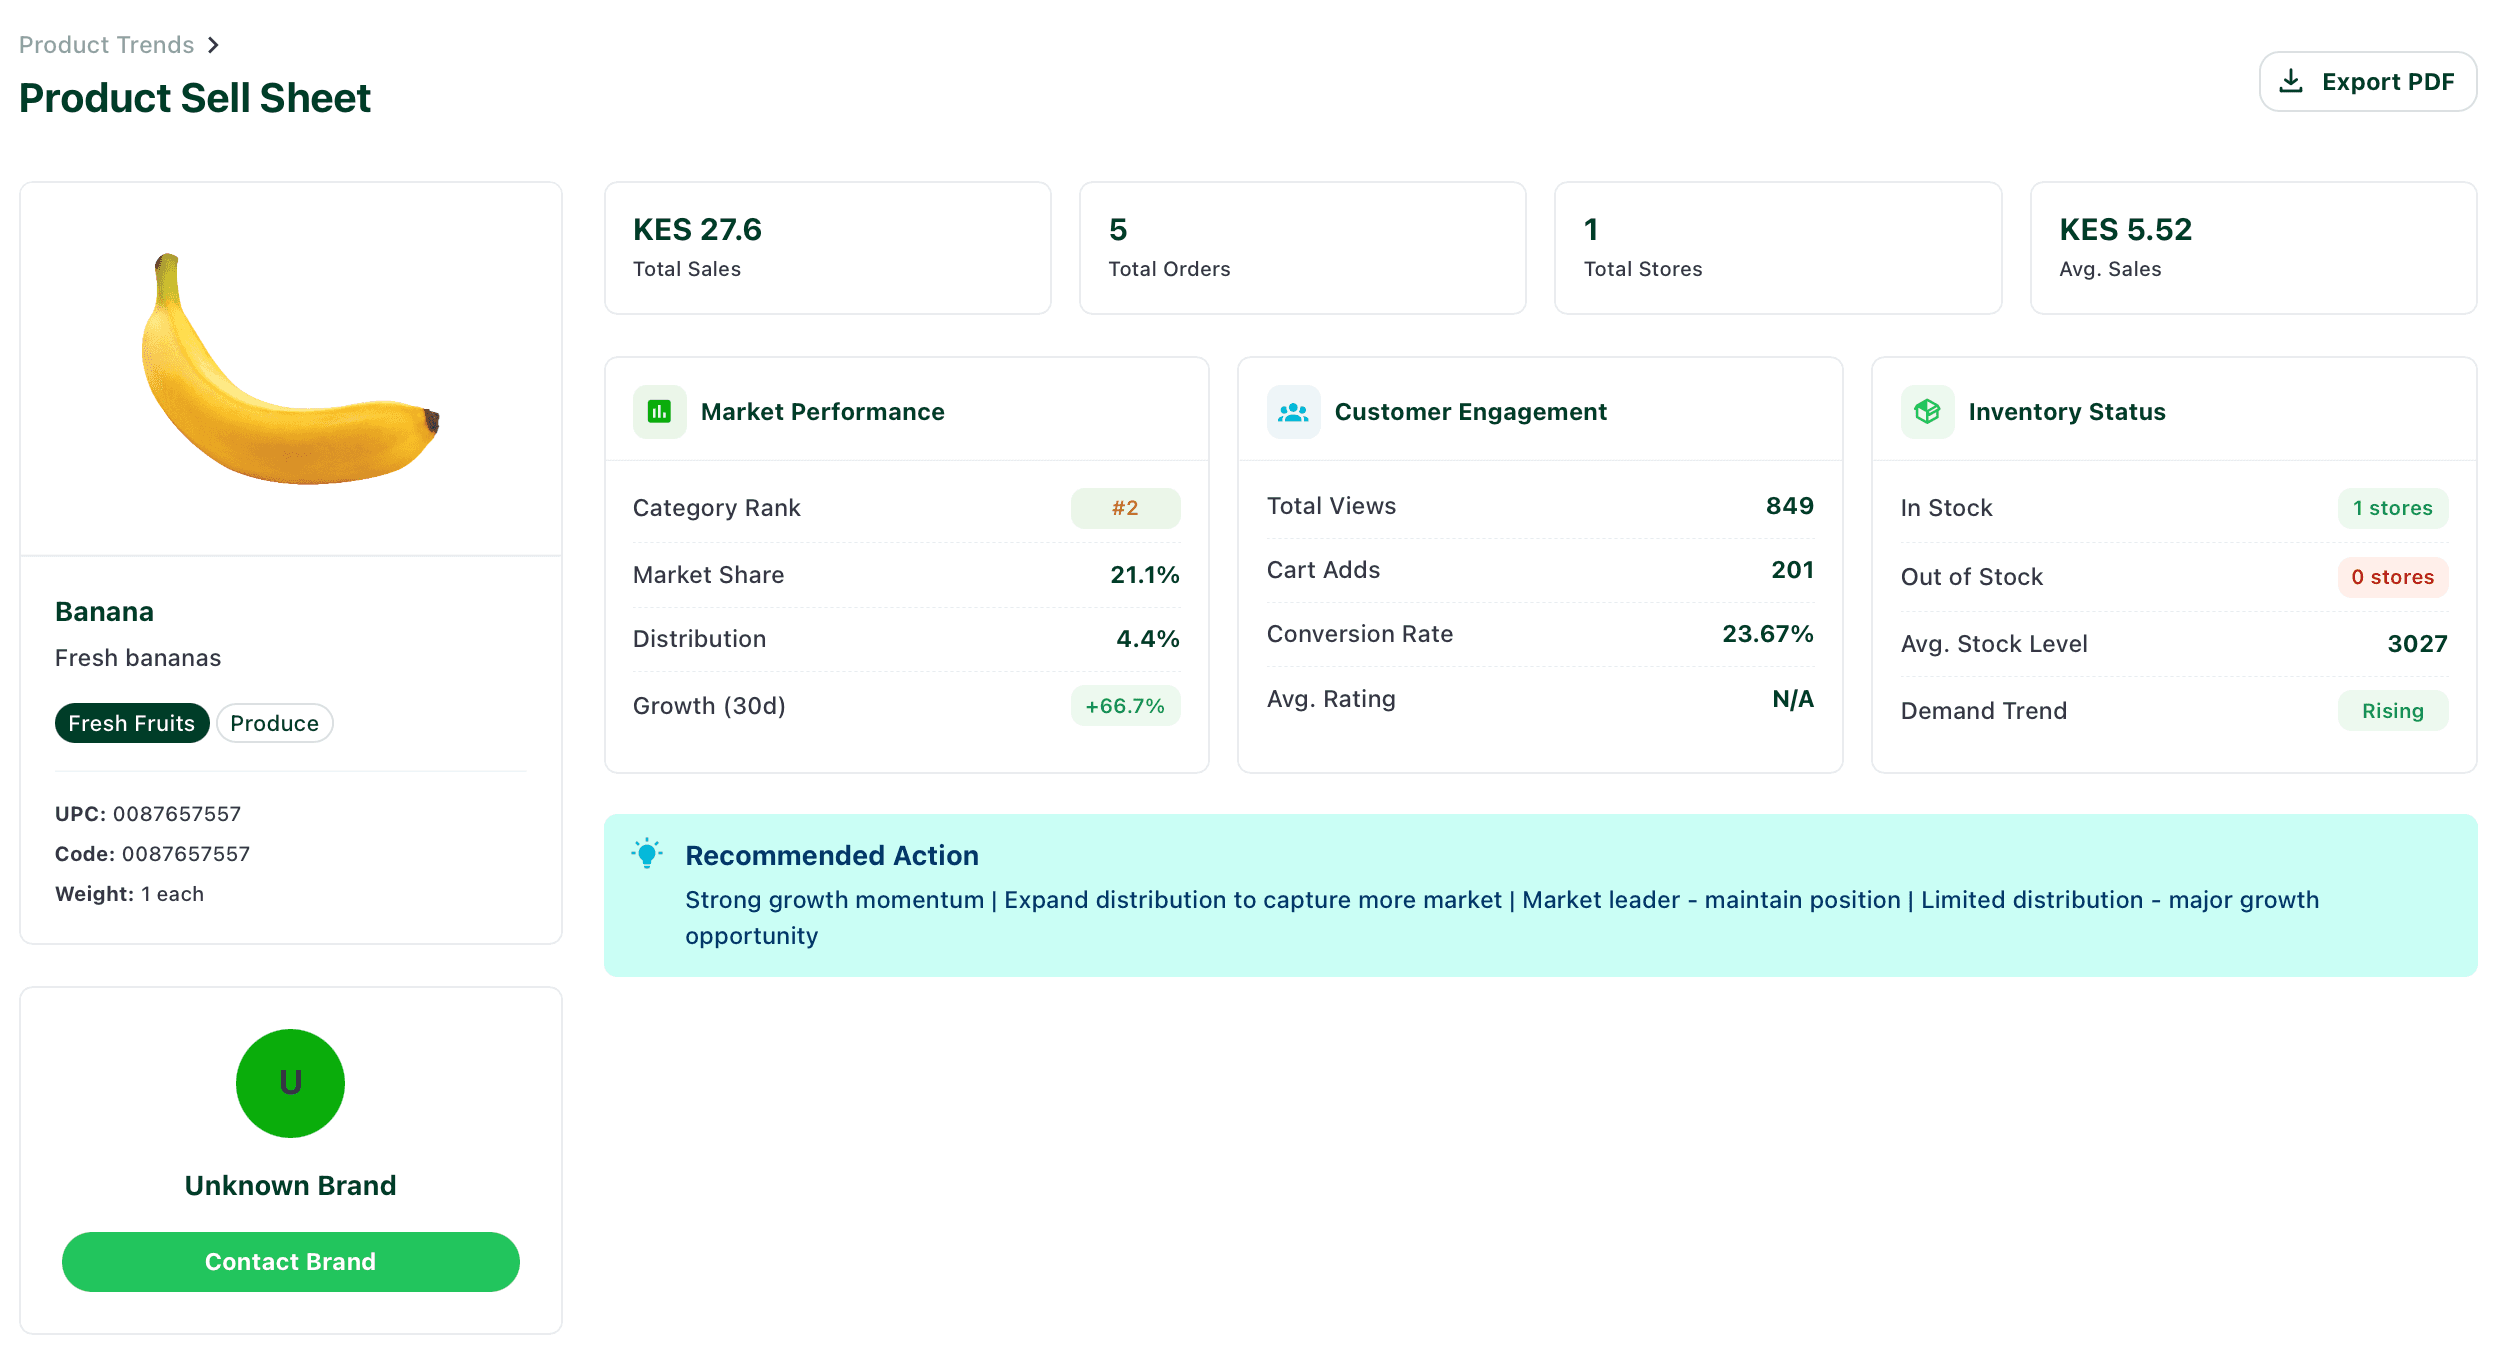
A. Categorization & Metadata
- Taxonomy: Displays the explicit Main Category and Sub-Category pathways to show exactly where the product anchors in your catalog.
- Brand Contact Info: Where applicable, direct operational contact details for the supplier are surfaced to facilitate immediate inventory or logistical updates.
B. High-Level Performance Metrics
Surfaced prominently at the top of the details panel are four foundational numbers:
- Total Sales: Aggregated lifetime or period gross revenue generated by the product.
- Total Orders: The absolute count of completed checkouts containing this product.
- Total Stores: The number of physical storefront locations currently stocking the item.
- Average Sales: The baseline average performance per location, identifying general velocity.
C. Market Performance Matrix
This module evaluates how your product stacks up against immediate sector competition:
- Category Rank: The product’s definitive numerical position within its specific sub-category.
- Market Share: The percentage of total sub-category sales volume captured by this product.
- Distribution: A percentage indicating how widely available this product is across your store network.
- Growth (30 Days): The trailing 30-day percentage acceleration or deceleration of the item’s sales velocity.
D. Customer Engagement Indicators
Understand consumer intent and satisfaction metrics before and after the purchase point:
- Total Views: Complete count of consumer views on the product’s specific detail page.
- Cart Adds: The absolute number of times customers added this item to their digital baskets.
- Conversion Rate: The final percentage ratio of views-to-completed checkouts.
- Average Rating: The aggregated score from customer reviews and star ratings.
E. Real-Time Inventory & Velocity Status
- Store Stock Status: A detailed look at the store locations where the product is In-Stock versus Out-of-Stock.
- Average Stock Level: The mean physical unit volume maintained across your active network.
- Demand Trend: A directional indicator showing whether real-time consumer velocity is Rising or Dropping.
4. Algorithmic Recommended Actions
To assist brand managers in executing immediate, profit-maximizing adjustments, the platform generates automated Strategic Recommendations based on a blend of market share, distribution, and demand data:
- Strong Growth Momentum: Expand distribution to capture more market.
- Market Leader: Maintain current positioning and ensure supply chain stability.
- Limited Distribution: Major growth opportunity — increase localized stock allocation.
5. Product Compliance & Specifications
Where applicable, the dashboard pulls physical product metrics straight from the core catalog layer to assist in compliance verification:
- Ingredients: Full text breakdown of product ingredients for allergy tracking.
- Nutritional Information: Complete macro-nutrient data and labeling details as displayed to the end-consumer.